Products | DQ Monitor
The data quality monitor: basis for process quality
Reliable data about vehicles, trips, driver hours, and deliveries is essential for safety and compliance, efficient planning, supply chain transparency, cost control, and sustainability reporting.
Poor data directly leads to inefficient routes, billing errors, and unreliable insights into profitability per customer and region. The risk: making decisions based on assumptions instead of facts.
The Data Quality monitor gives you daily insights into your data quality and serves as a foundation in your data platform.
Source data
Primary data is key!
Data trail
always visible for accounting or banking
Own
platform with your business rules and prices
Subsidy
Start now with subsidy from the Return Flow Scheme
DQ Monitor explained
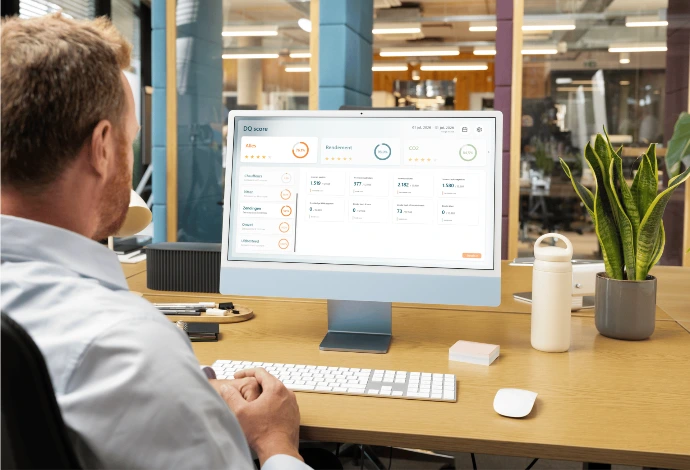
Eight categories, daily insights.
The Data Quality monitor is in your data platform and provides daily refreshed insights. Company-specific business rules and cost prices are entered for data recognition. With the connection of your onboard computer, actual driven kilometers are added, so your insights are also based on post-calculation are built.
This is how it works
From connection to shared interest
1
Connecting systems
Retrieving data through connection with TMS (and onboard computer) on your data platform, designed in your corporate identity.
2
Installing monitor
Basic setup and validation (correct data in the right place) of the Data Quality monitor by Bricklog specialists.
3
Customization
Applying specific business rules and cost prices, setting up user management, final validation together with you and your team.
4
Change management
Optional: data quality becomes a shared interest of the entire organization. Teams know their own responsibilities.
Exclusively primary data
No estimates or repaired figures afterwards, improve directly at the source.
Data-trail
A complete data trail for your accounting.
Refreshed during the night
During the weekend 8 weeks ago, upon request, further back for clean data.
CoFred-method
Combine, interpret, and enrich according to the CoFred method, ISO 14083 verified.
Why you can trust these numbers
Improved at the source, not repaired in the report
Coming soon: Data quality alert function
Set your own baseline for your overall data quality percentage (for example, 86%). If your data quality remains below this level for 5 days, you will automatically receive a notification. If the score remains above this level for 5 days, you will automatically be invited to increase your percentage.
Request a 30-minute online demo. Ready to go? Then we will also arrange your subsidy.
